Research
NIRWALS Observations of Post-Starburst Galaxies
UW-Madison's Washburn Astronomical Labs recently delivered a new near infrared (NIR) integral field spectrograph called NIRWALS for the 11-meter SALT telescope (PI: Wolf; Wolf+2022, Oppor+2022, Smith+2022). I am currently working with Prof. Christy Tremonti and Dr. Marsha Wolf on the data reduction and analysis pipelines for these new and exciting data of nearby (z < 0.05) post-starburst galaxies.
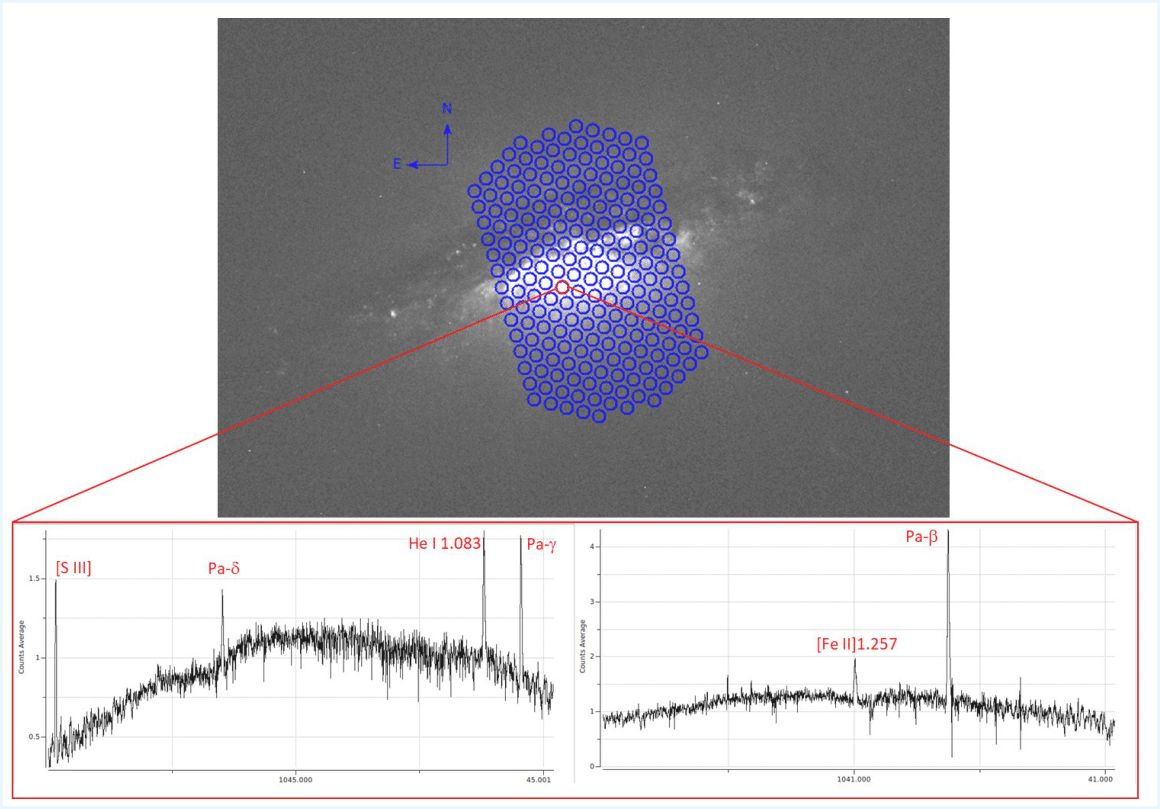
Figure 1: Test observations of NCG 1482 at z=0.006 during initial NIRWALS comissioning (Oct. 2022). Top: The background image is taken from the Hubble Legacy Archive and the integral field unit (IFU) setup is shown by the overlayed blue circles. This galaxy is an ultra-luminous infrared galaxy, with molecular and ionized gas outflows perpendicular to its disk (Salak+2020) and along the IFU orientation. Bottom: Spectra collected for a single fiber (shown in red) positioned on the galaxy.
Probing Bursty Star Formation in Galaxies
Bursty star formation has been proposed as one of the potential key mechanisms behind the overabundance of bright galaxies observed at Cosmic Dawn (z ≥ 10; e.g., Sun+2023a-b, Shen+2023, Mason+2023). In this work, we probe recent star-formation variability in galaxies using the Hα-to-UV ratio. This is a ratio of two time-sensitive tracers of star formation, allowing us to determine if the star-formation rate (SFR) of a given galaxy has changed significantly over the past ~100 Myr.
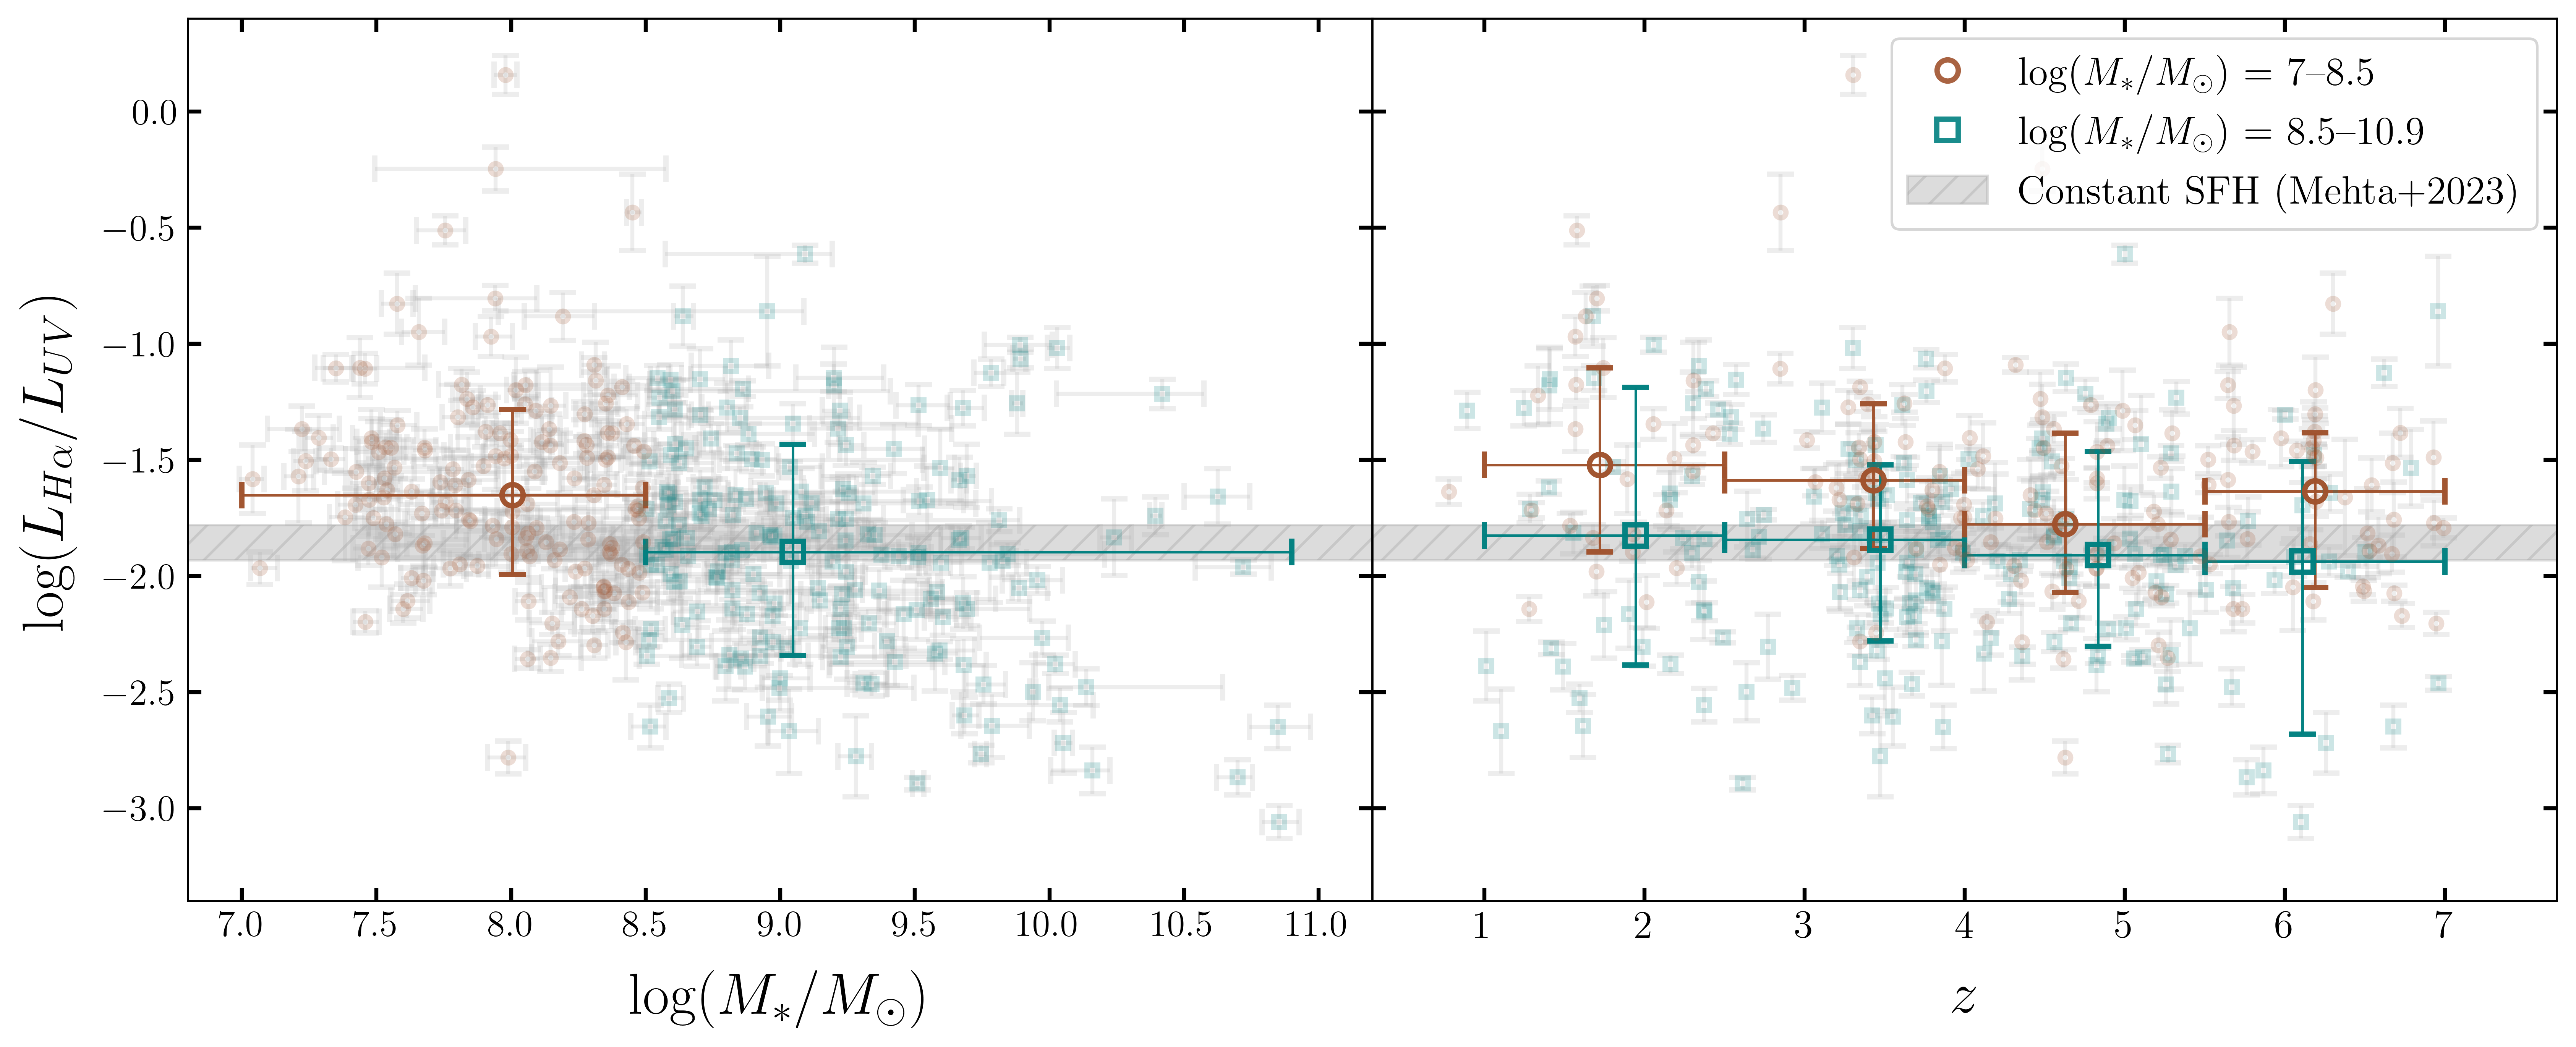
Figure 2: The Hα-to-UV ratio vs. stellar mass (left panel) and redshift (right panel) for our galaxy sample, binned by stellar mass. The large points represent the median values in each stellar mass bin, with the horizontal error bars denoting the stellar-mass and redshift ranges and the vertical error bars denoting the 16th and 84th percentile Hα-to-UV ratio values. Lower-mass galaxies maintain higher Hα-to-UV ratio values across all redshifts probed, consistent with more burst-driven star formation (M. N. Perry et al. (2025)).
High-Redshift Galaxy Catalog Cleaning with ML
I collaborated in developing automated methods for cleaning catalogs of high-redshift galaxies using public JWST NIRCam imaging data. These methods involved (Figure 2) implementing an unsupervised non-linear dimensionality reduction technique with a clustering algorithm and (Figure 3) building a convolutional neural network binary image classifier. These methods were included in Cycle 3 and 4 proposals for JWST (PI: Steven Finkelstein).
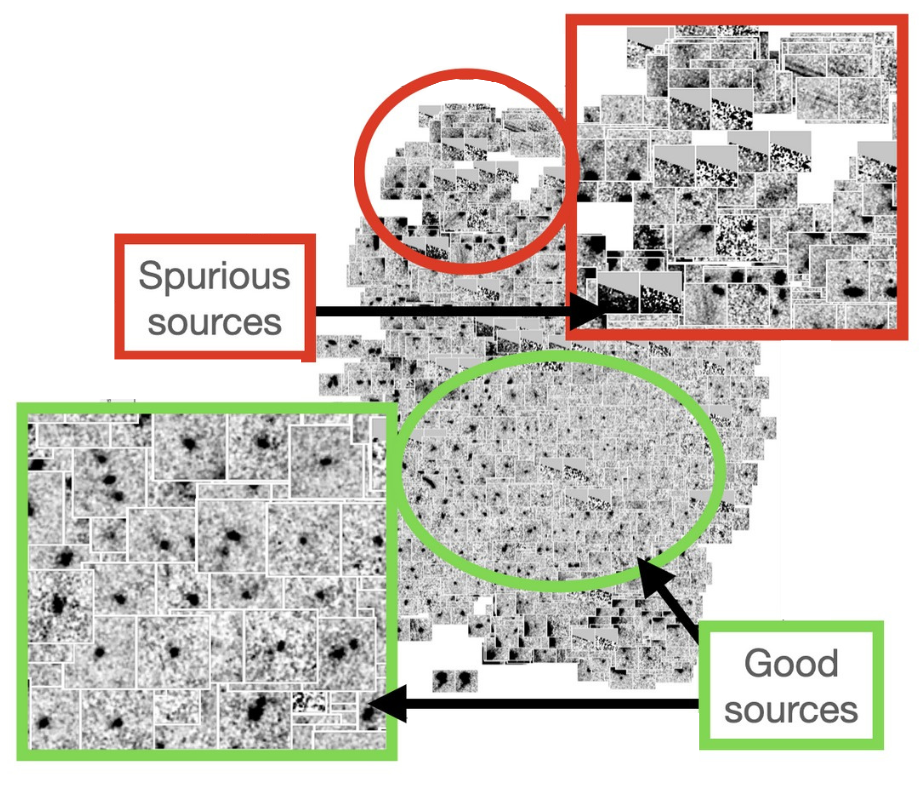
Figure 2: Dimensionally reduced images of 2,310 high-redshift galaxies from the NGDEEP survey. Each source is represented by their image in the F150W and F277W filters.
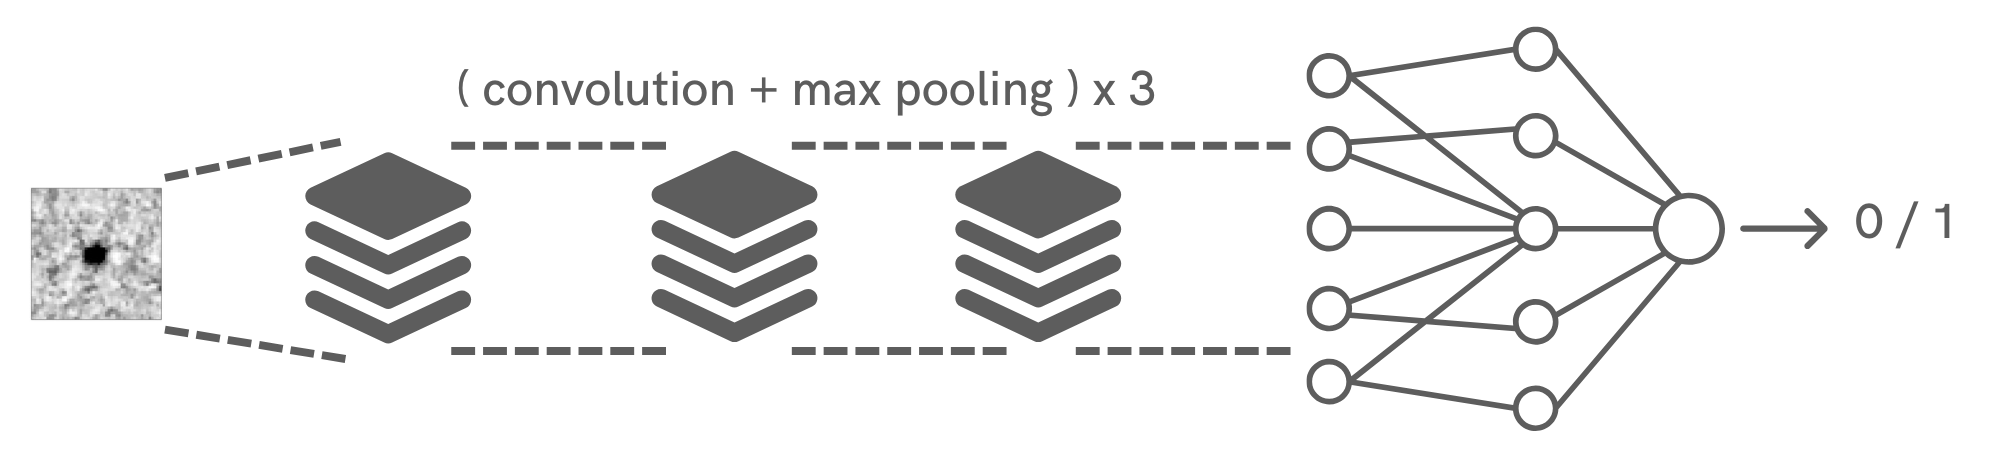
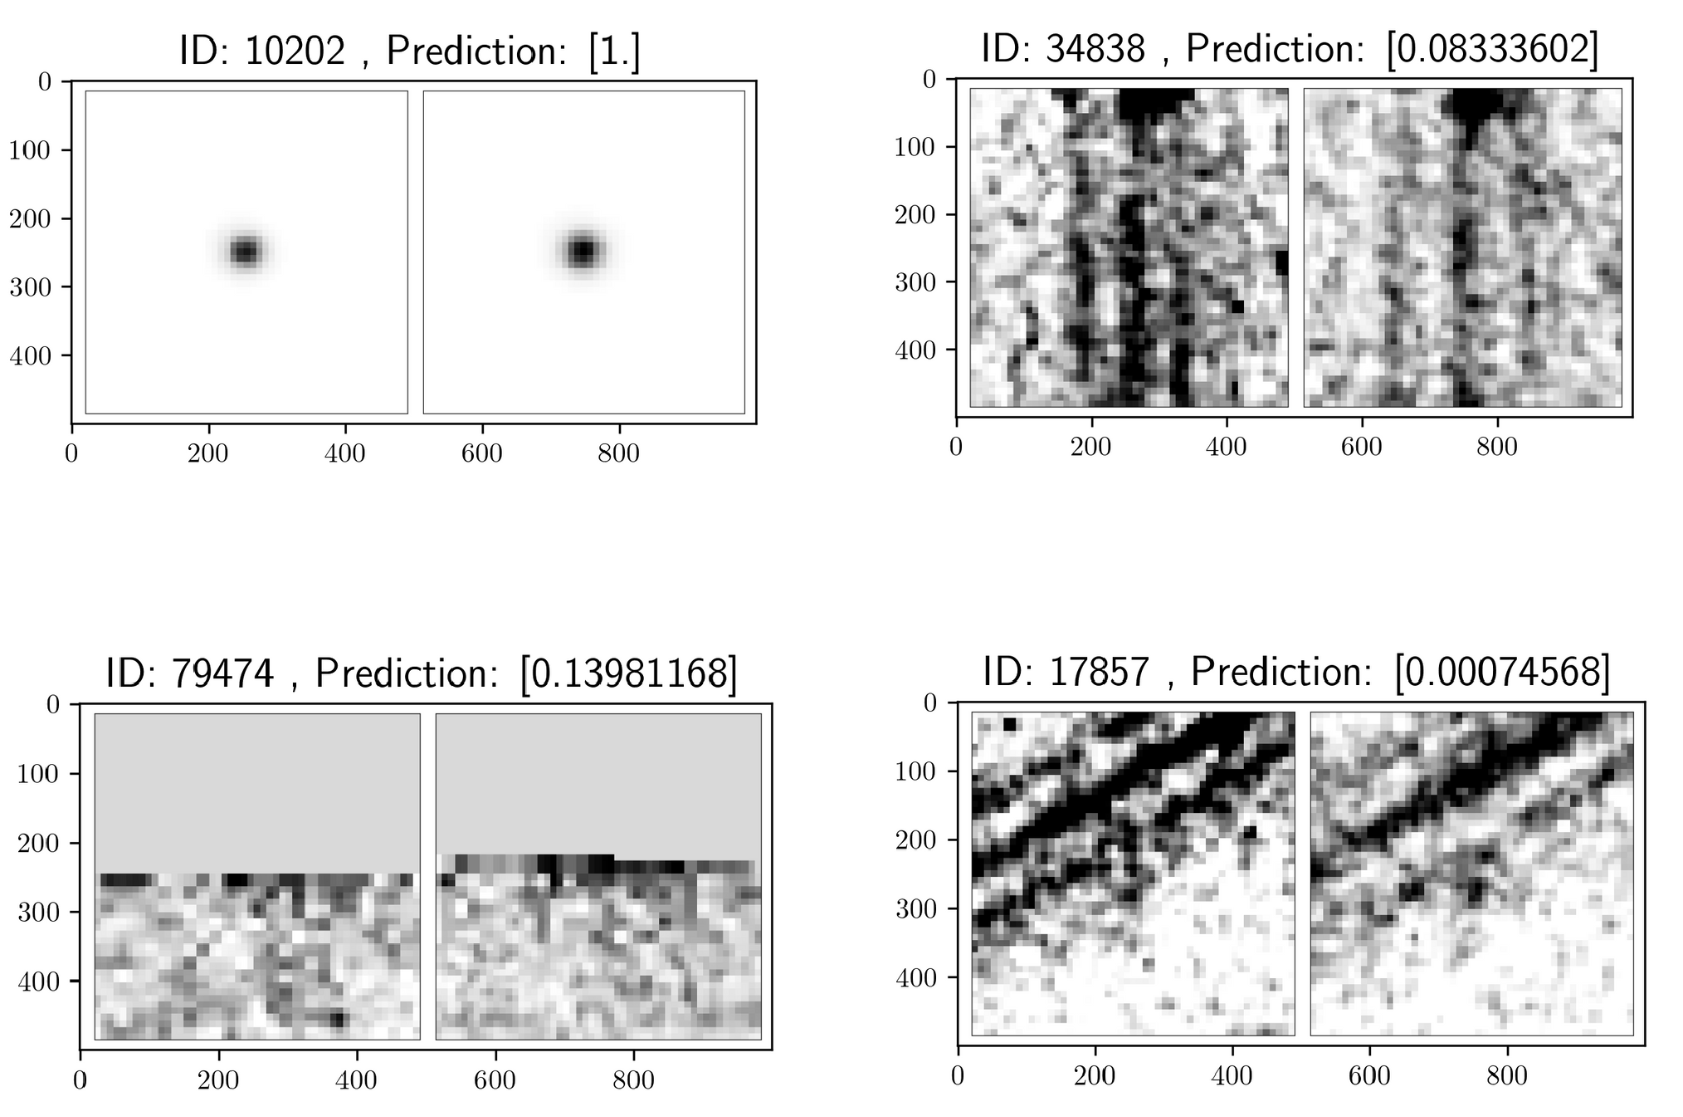
Figure 3: Top: CNN architecture. Bottom: example predictions on high-redshift galaxies from the CEERS survey, where predictions near 0 or 1 indicate spurious or real sources, respectively.